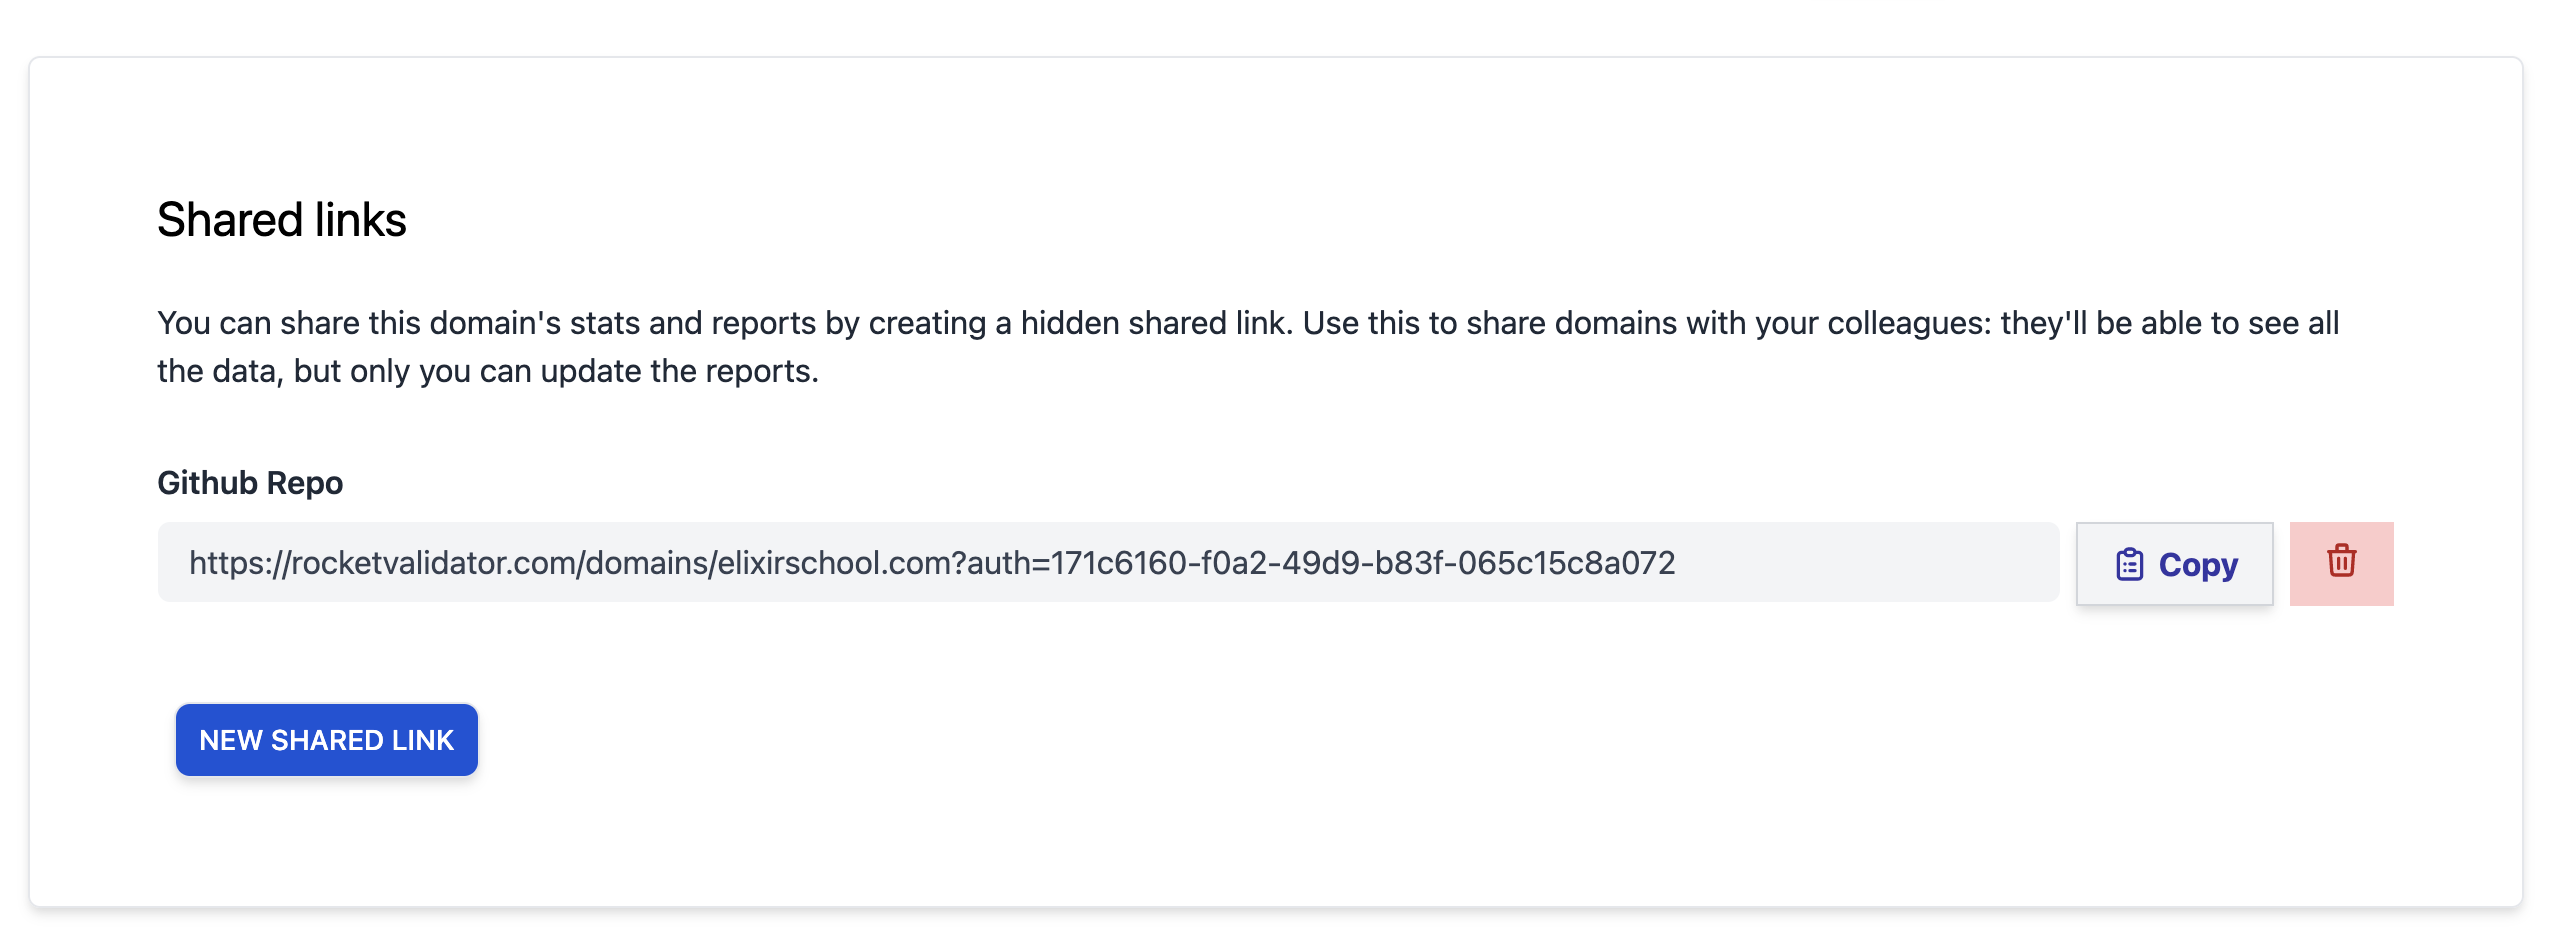
Update: the Domain Stats section has been replaced with the new Stats section.
We've just released a new section called Domain Stats, that replaces the previous charts feature in reports.
The main limitation of the previous report charts is that they were limited to the report scope: they only gave a comparison with older reports that had the same starting URL. If you had several reports for the same domain, covering different sets of web pages, the current charts didn't give the total stats for that domain.
Instead, the new domain stats provide daily snapshots of the issue counters, getting the most recent results for the web pages checked in different reports. If a web page has been checked in several reports, we'll take the freshest one to be included in the daily stats.
Domains List
The new Domain Stats section lists all the domains you're working on, based on the reports you've run. A search bar on top lets you filter the domains shown by their URL.
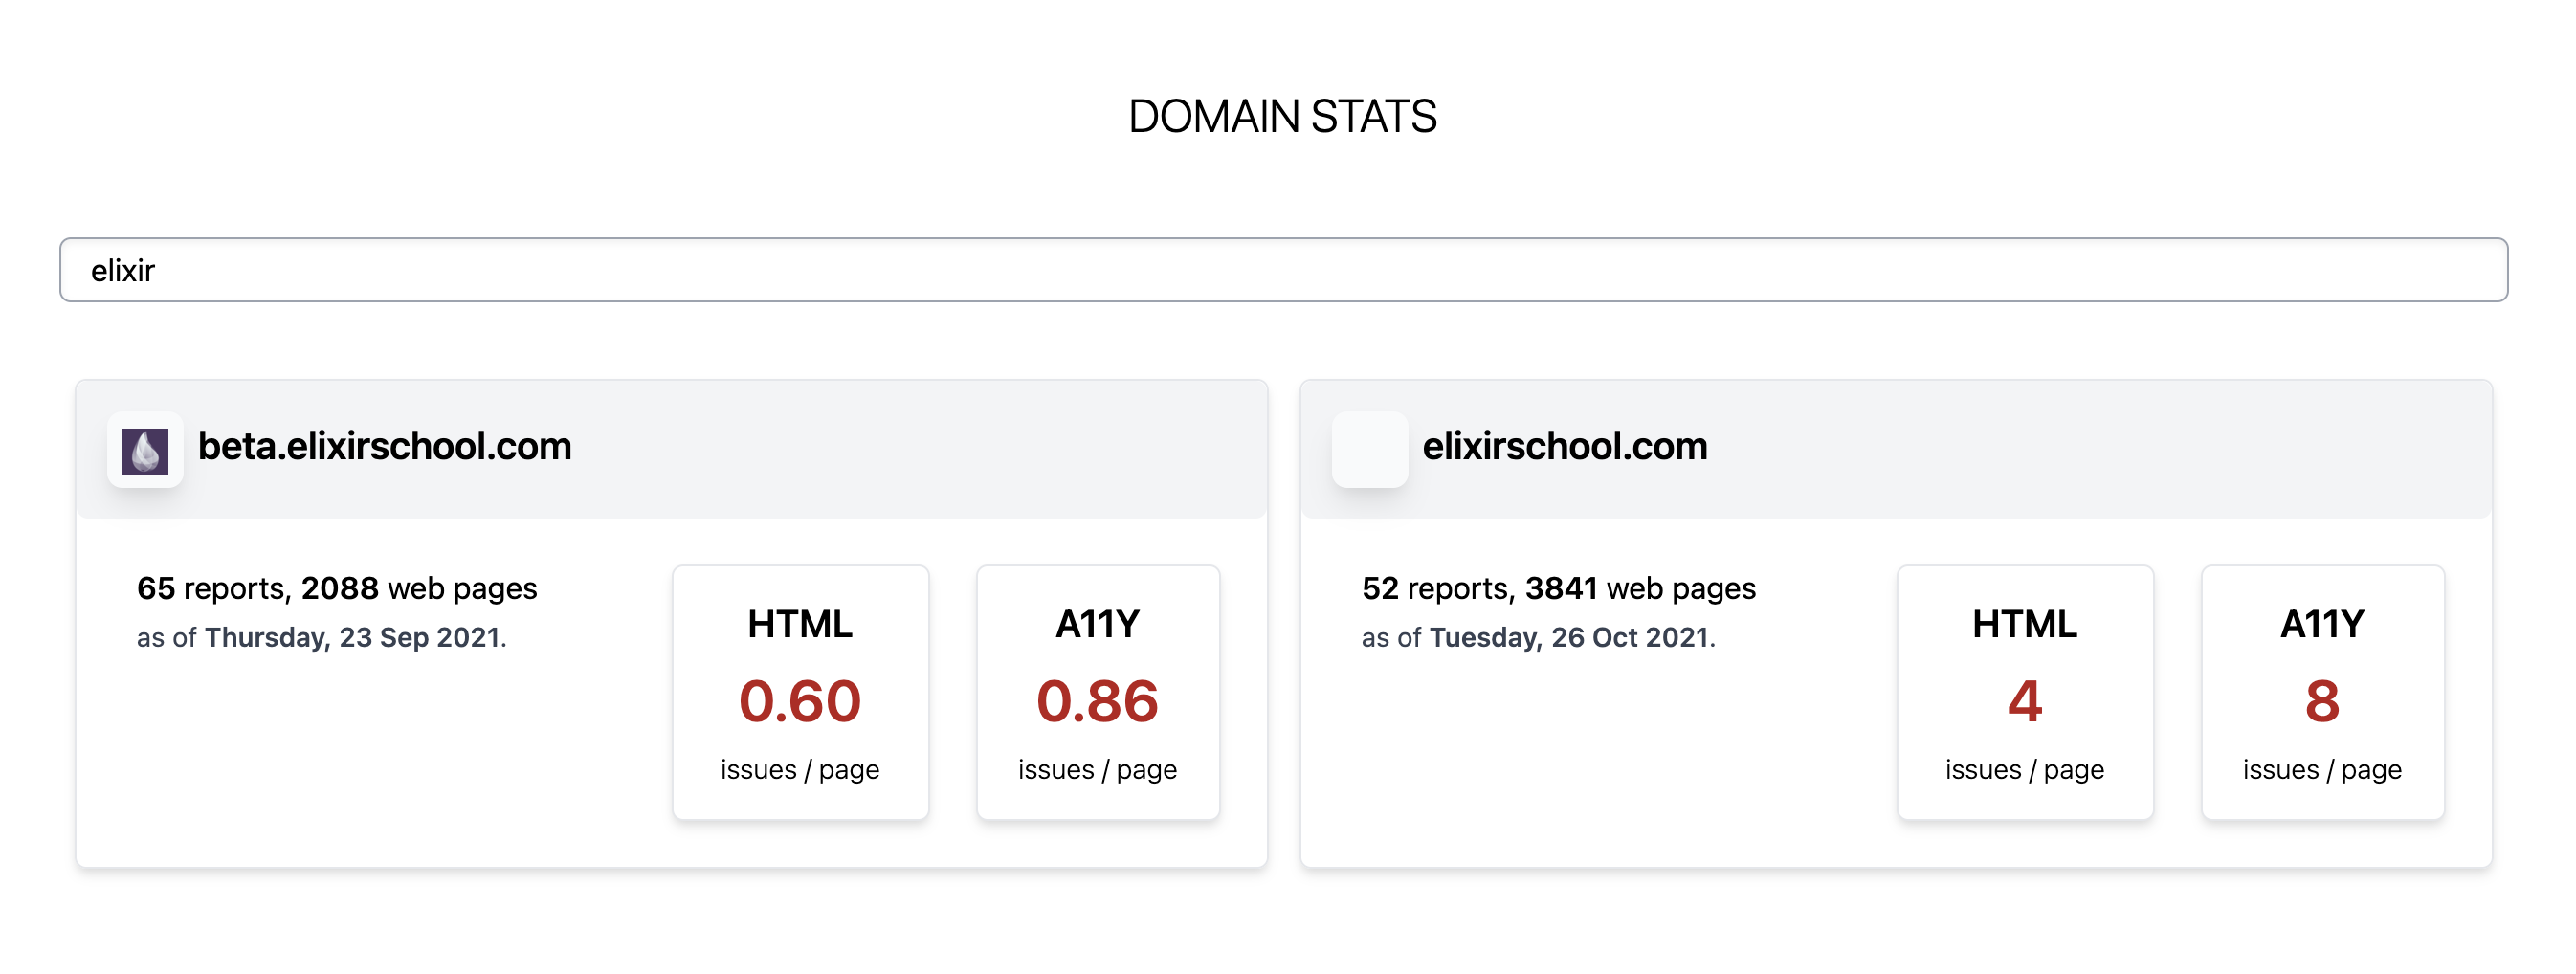
For each domain shown in this list, the following info is included for the last date with activity on that domain when available:
- Number of reports for that domain.
- Total number of web pages covered in the different reports, by unique URL.
- HTML issue density (issues per web page).
- Accessibility issue density (issues per web page).
Domain Charts
Clicking on a domain from that list will get you to the details for that domain, based on daily snapshots from your reports.
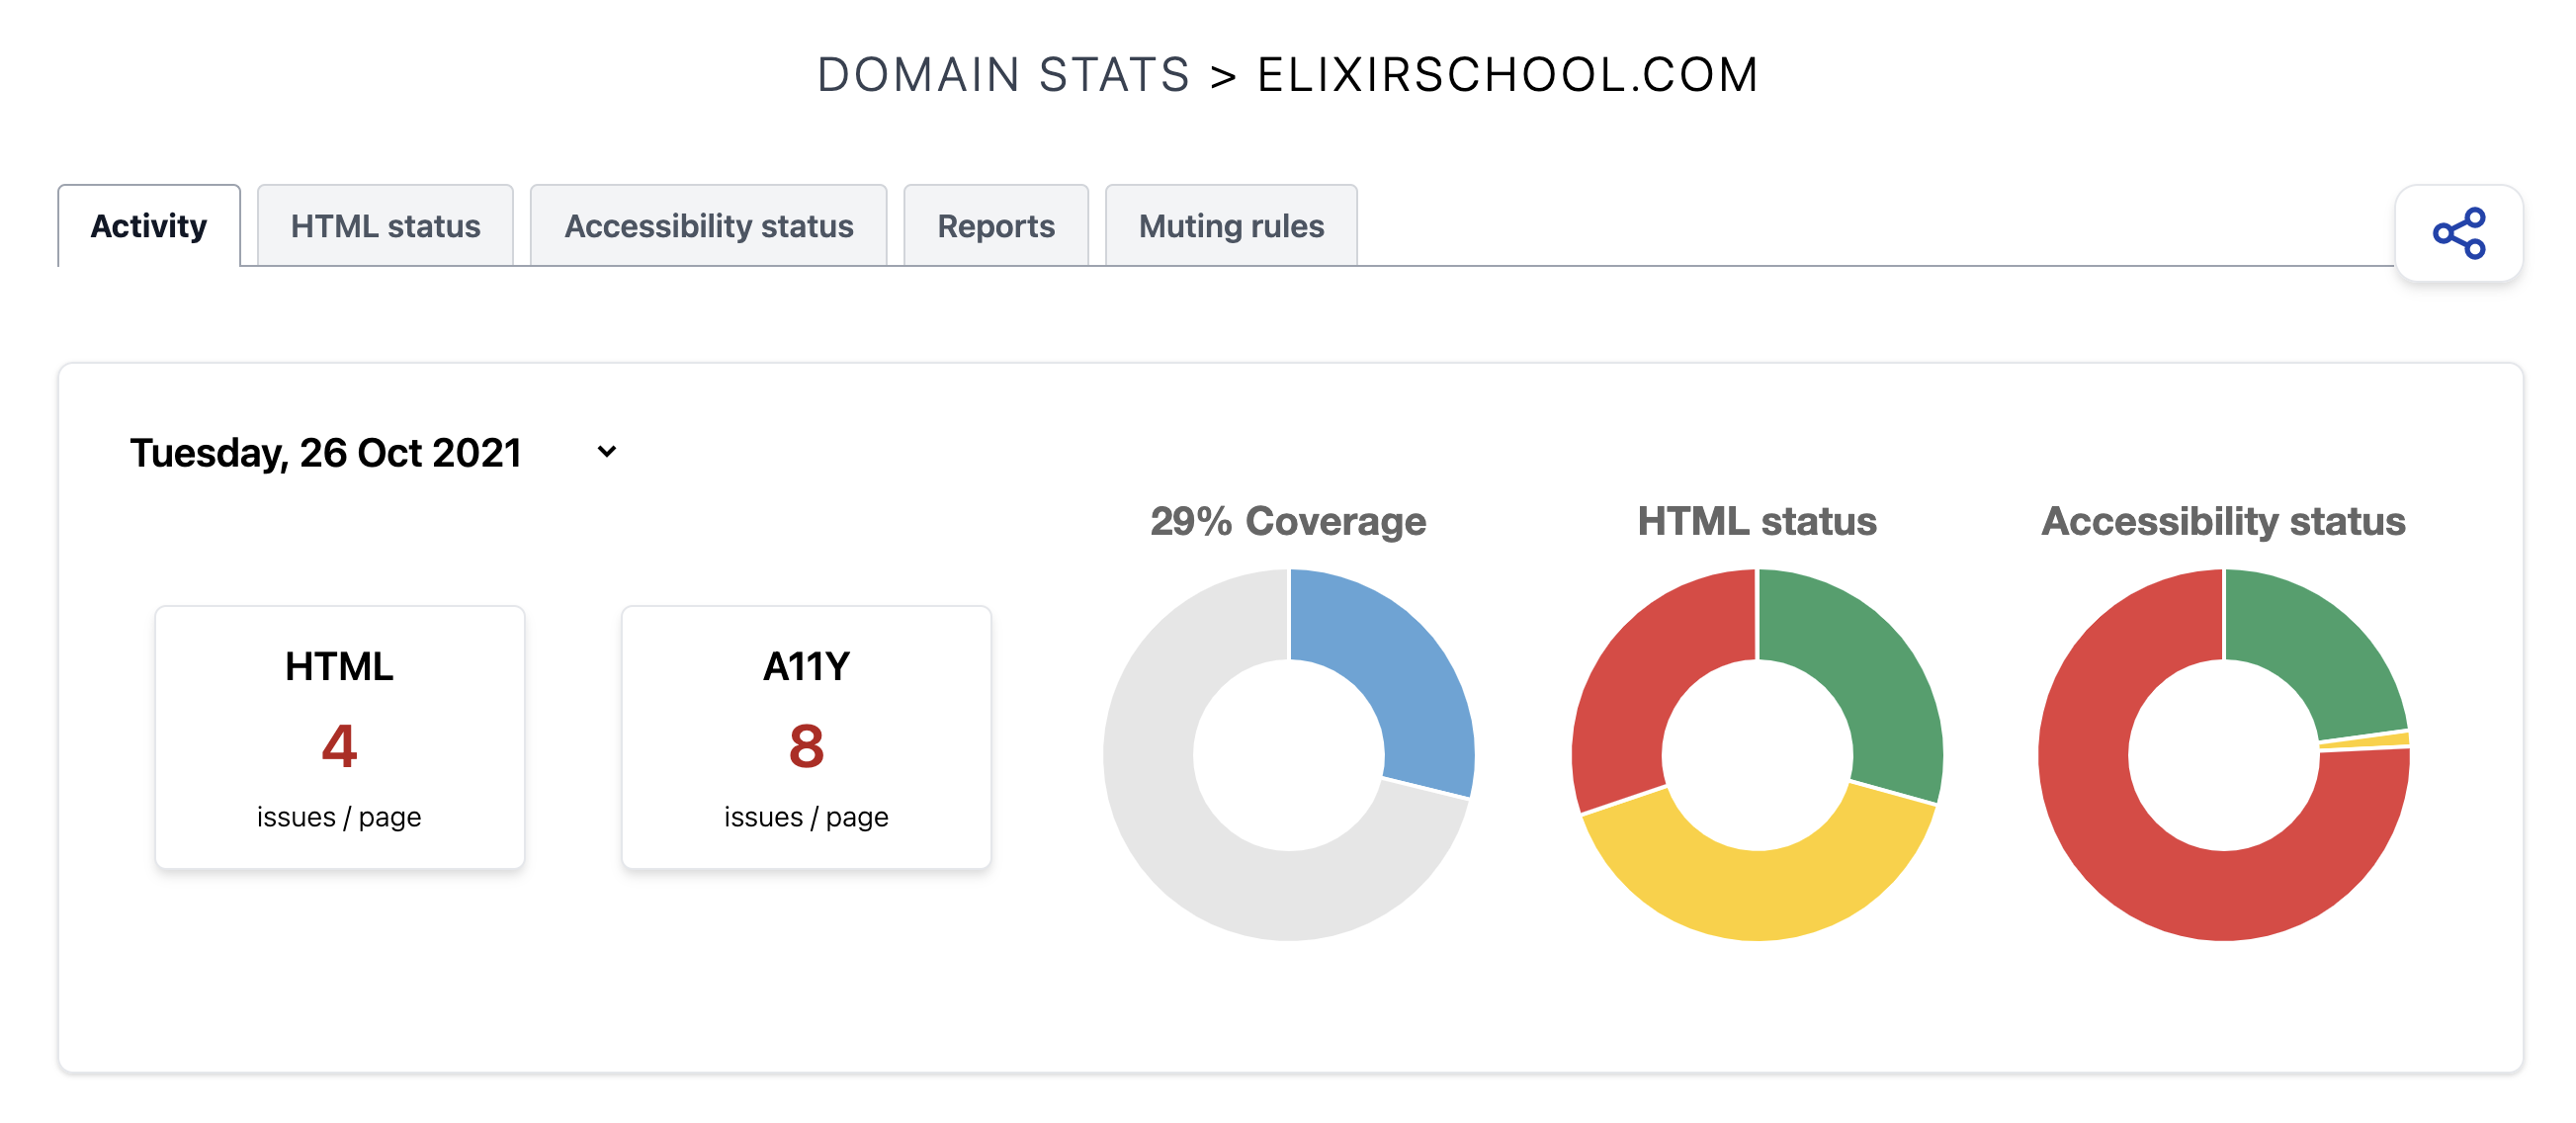
You can refer to the Domain Stats Documentation for all the details, but the main concepts that we want to highlight in this blog post are:
### Domain Stats are updated daily
We generate daily stats with the latest data from your reports. Even if you delete the reports, we keep these counters stored so you can refer to them later to track your evolution.
Basic users have their stats stored for 90 days; Pro users have stats stored for 365 days.
Dates with activity are the main keypoints
Bar and line charts offer an evolution of your domain quality over time. On the horizontal axis, we show the different days, and we only include data for the dates with activity.
For example, the following bar chart shows the evolution of web page coverage over time. For each date with activity, a bar is shown. The higher the bar, the more web pages were known by Rocket Validator at that time for that domain. The proportion in each bar shows the number of checked web pages VS. stale web pages.
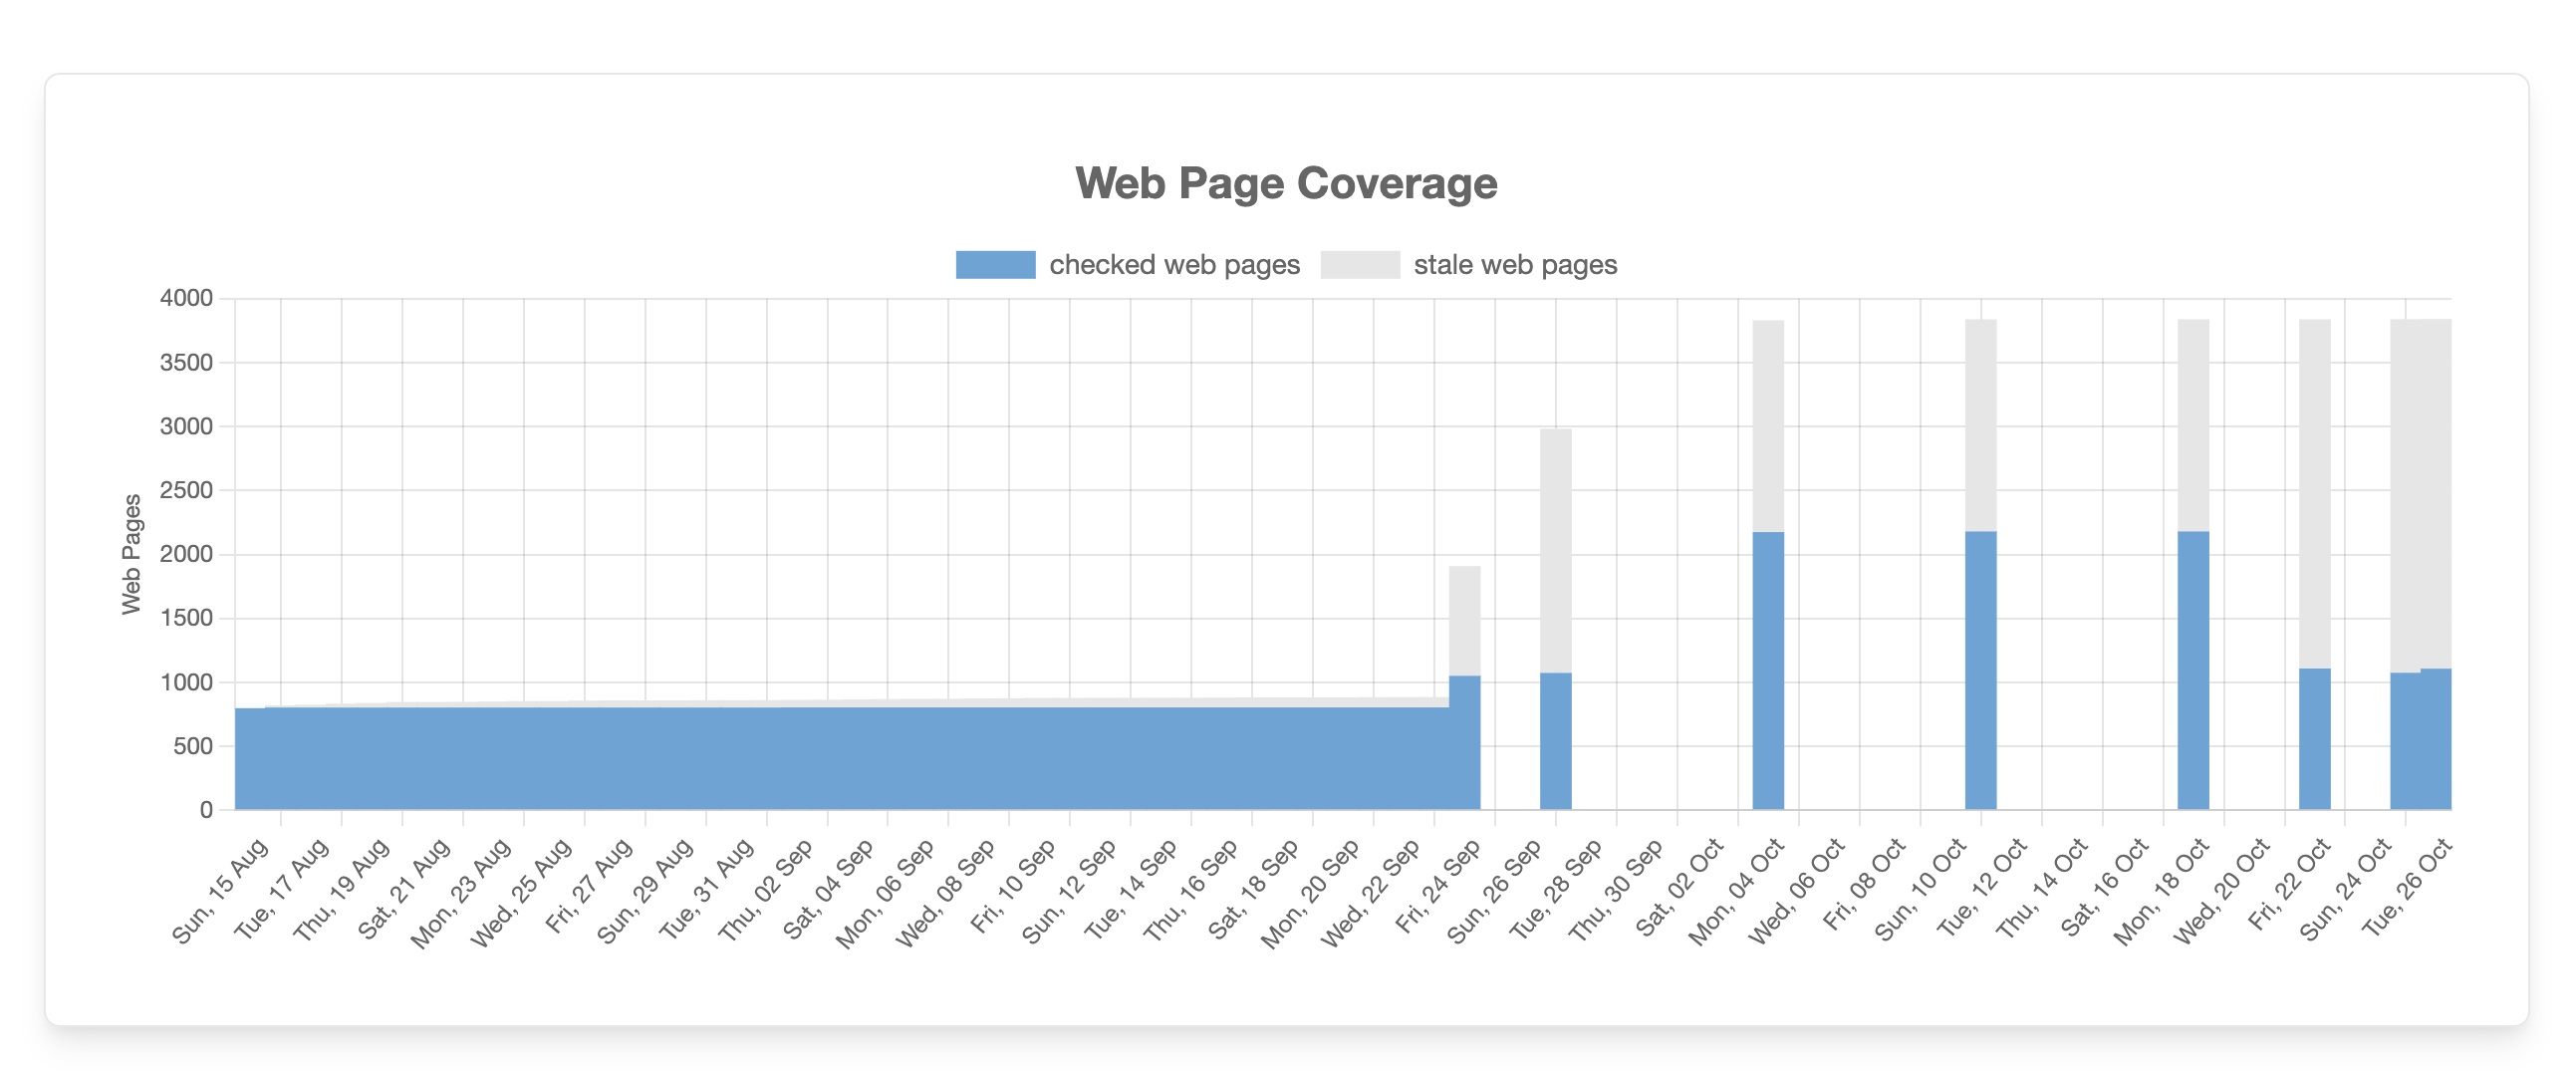
Also, the gaps in this bar chart show the activity for that domain. In the first half of the chart the domain was checked daily, in the second half we see that the domain was checked weekly, so there are gaps for the days without activity. At the end of the chart, there's daily activity again.
HTML and Accessibility status and density evolution
The HTML Status and Accessibility Status include charts to help you understand how your domain is evolving in terms of HTML and Accessibility quality, based on data from your reports.
Two kind of charts are included in this tab, the first one is a bar chart showing the evolution over time of the HTML or Accessibility status for checked web pages.
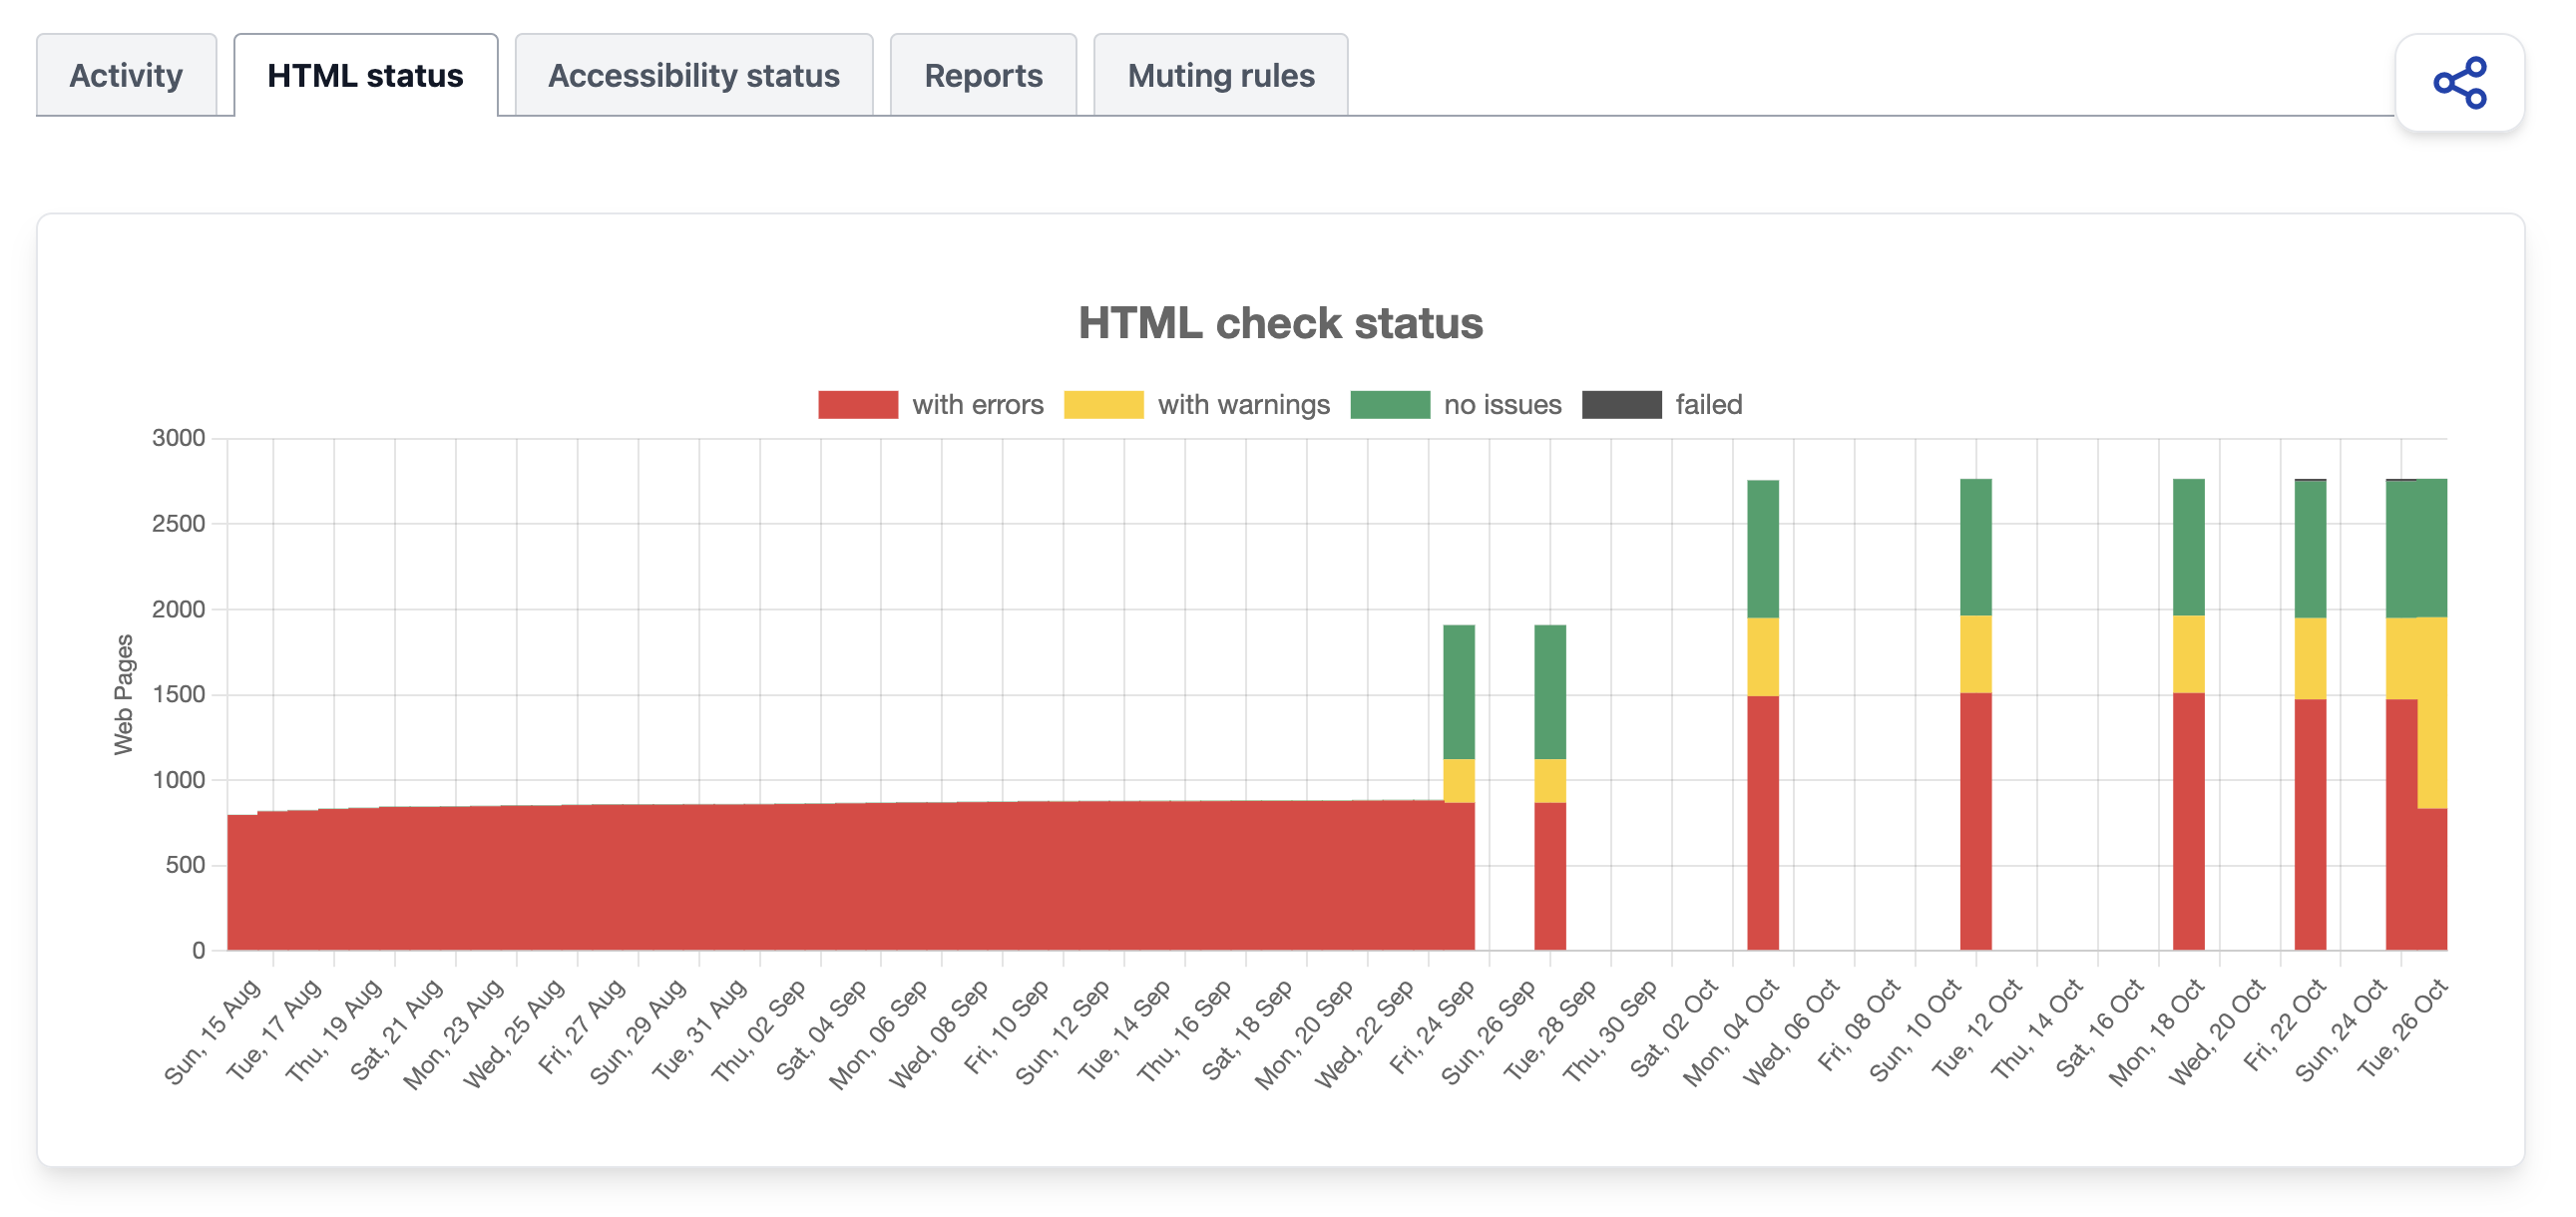
Time is represented in the horizontal axis, and a bar is shown on the dates where there was activity for that domain. Each bar shows the proportion of web pages with errors (red), with only warnings (yellow), without issues (green) or failed (black).
Bar height represents the total number of web pages known at that time for that domain.
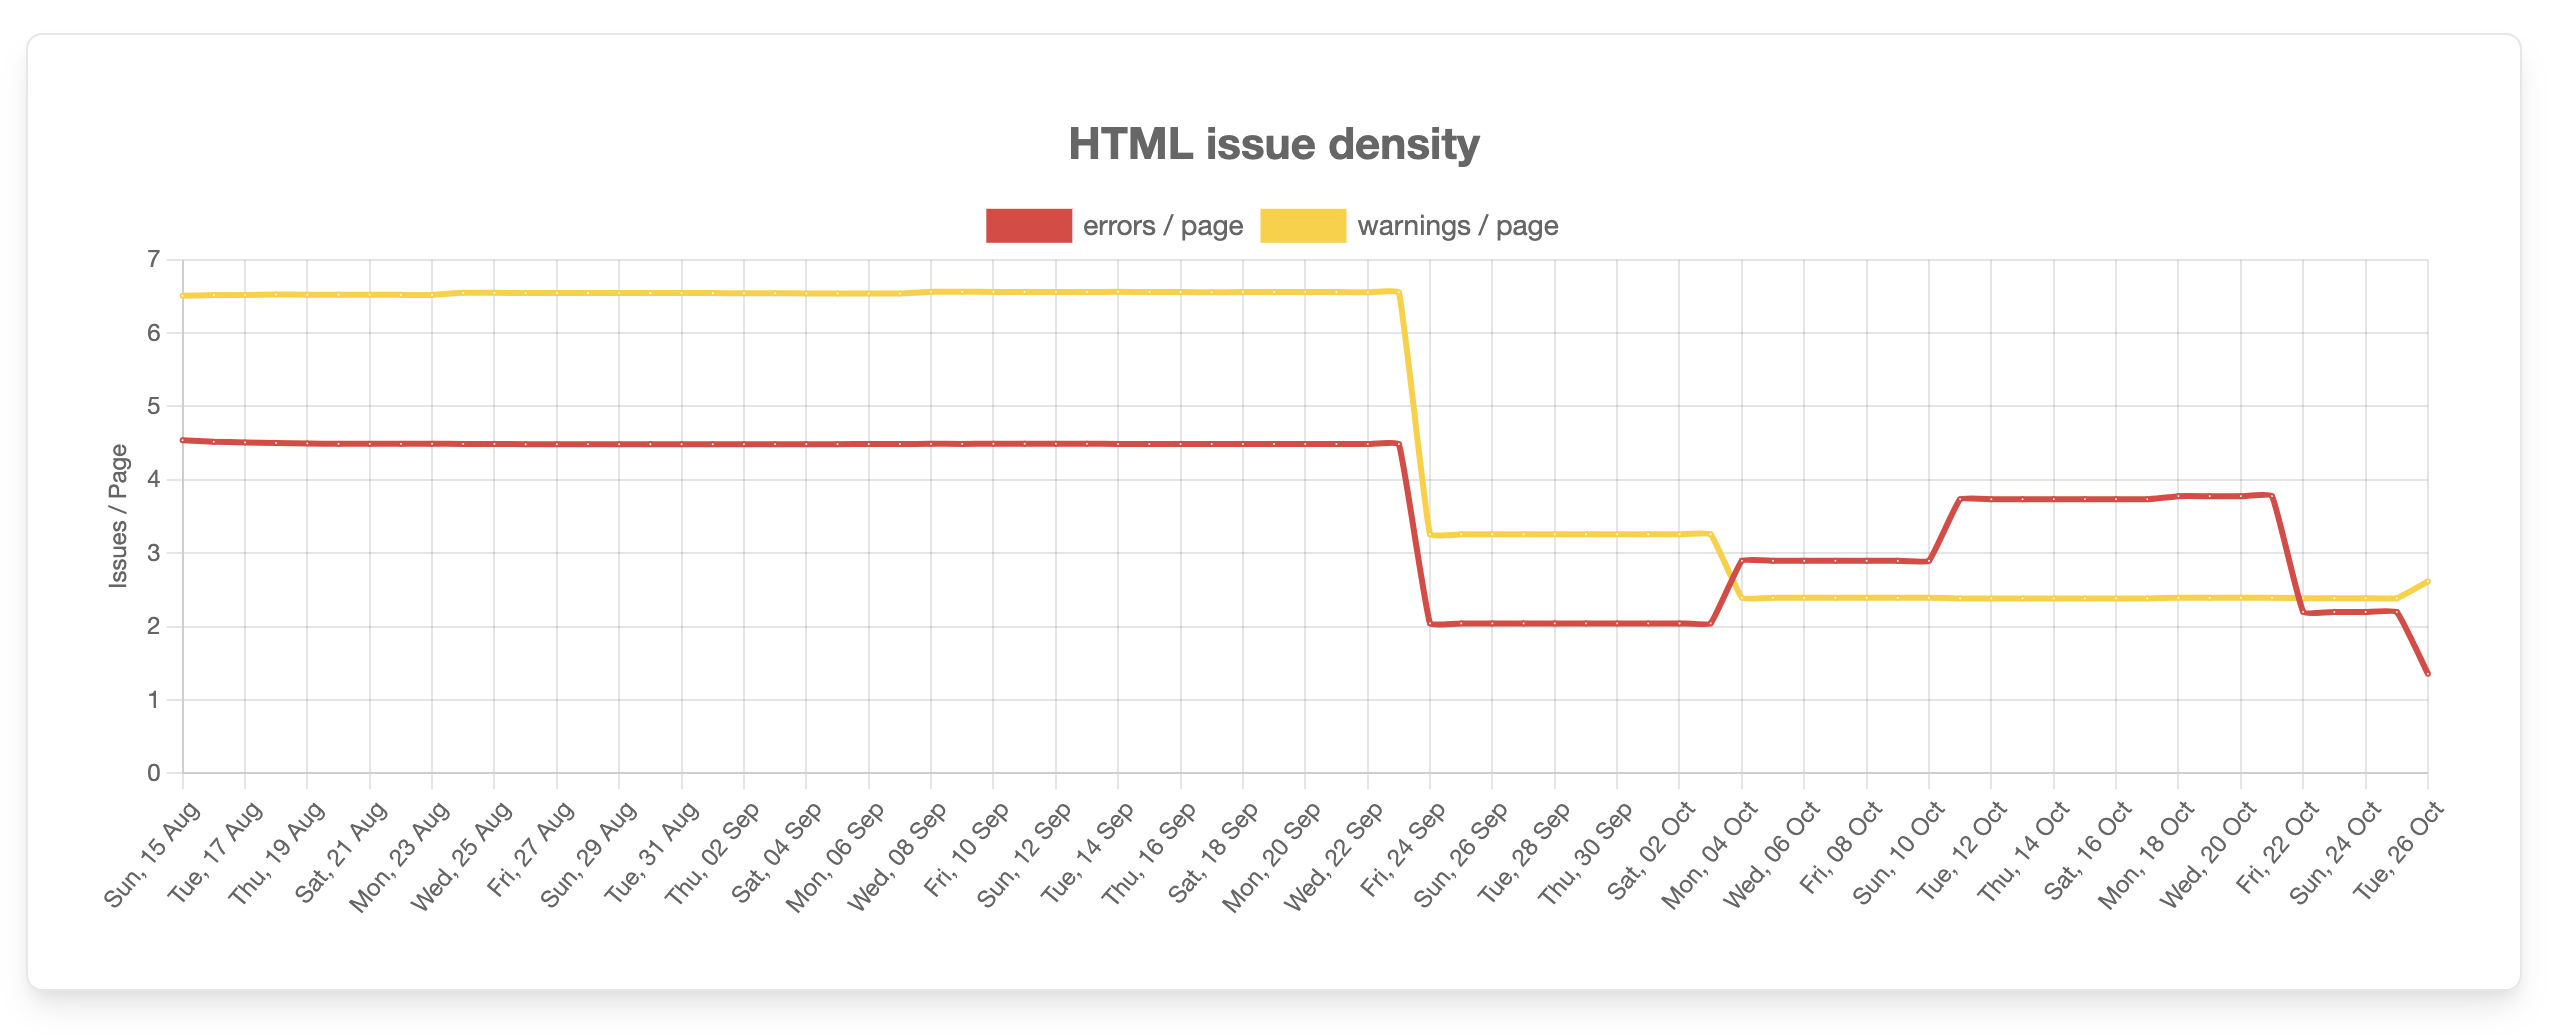
The next line chart shows the evolution of HTML issue density for errors and warnings, in terms of issues per web page.
Reports for a domain
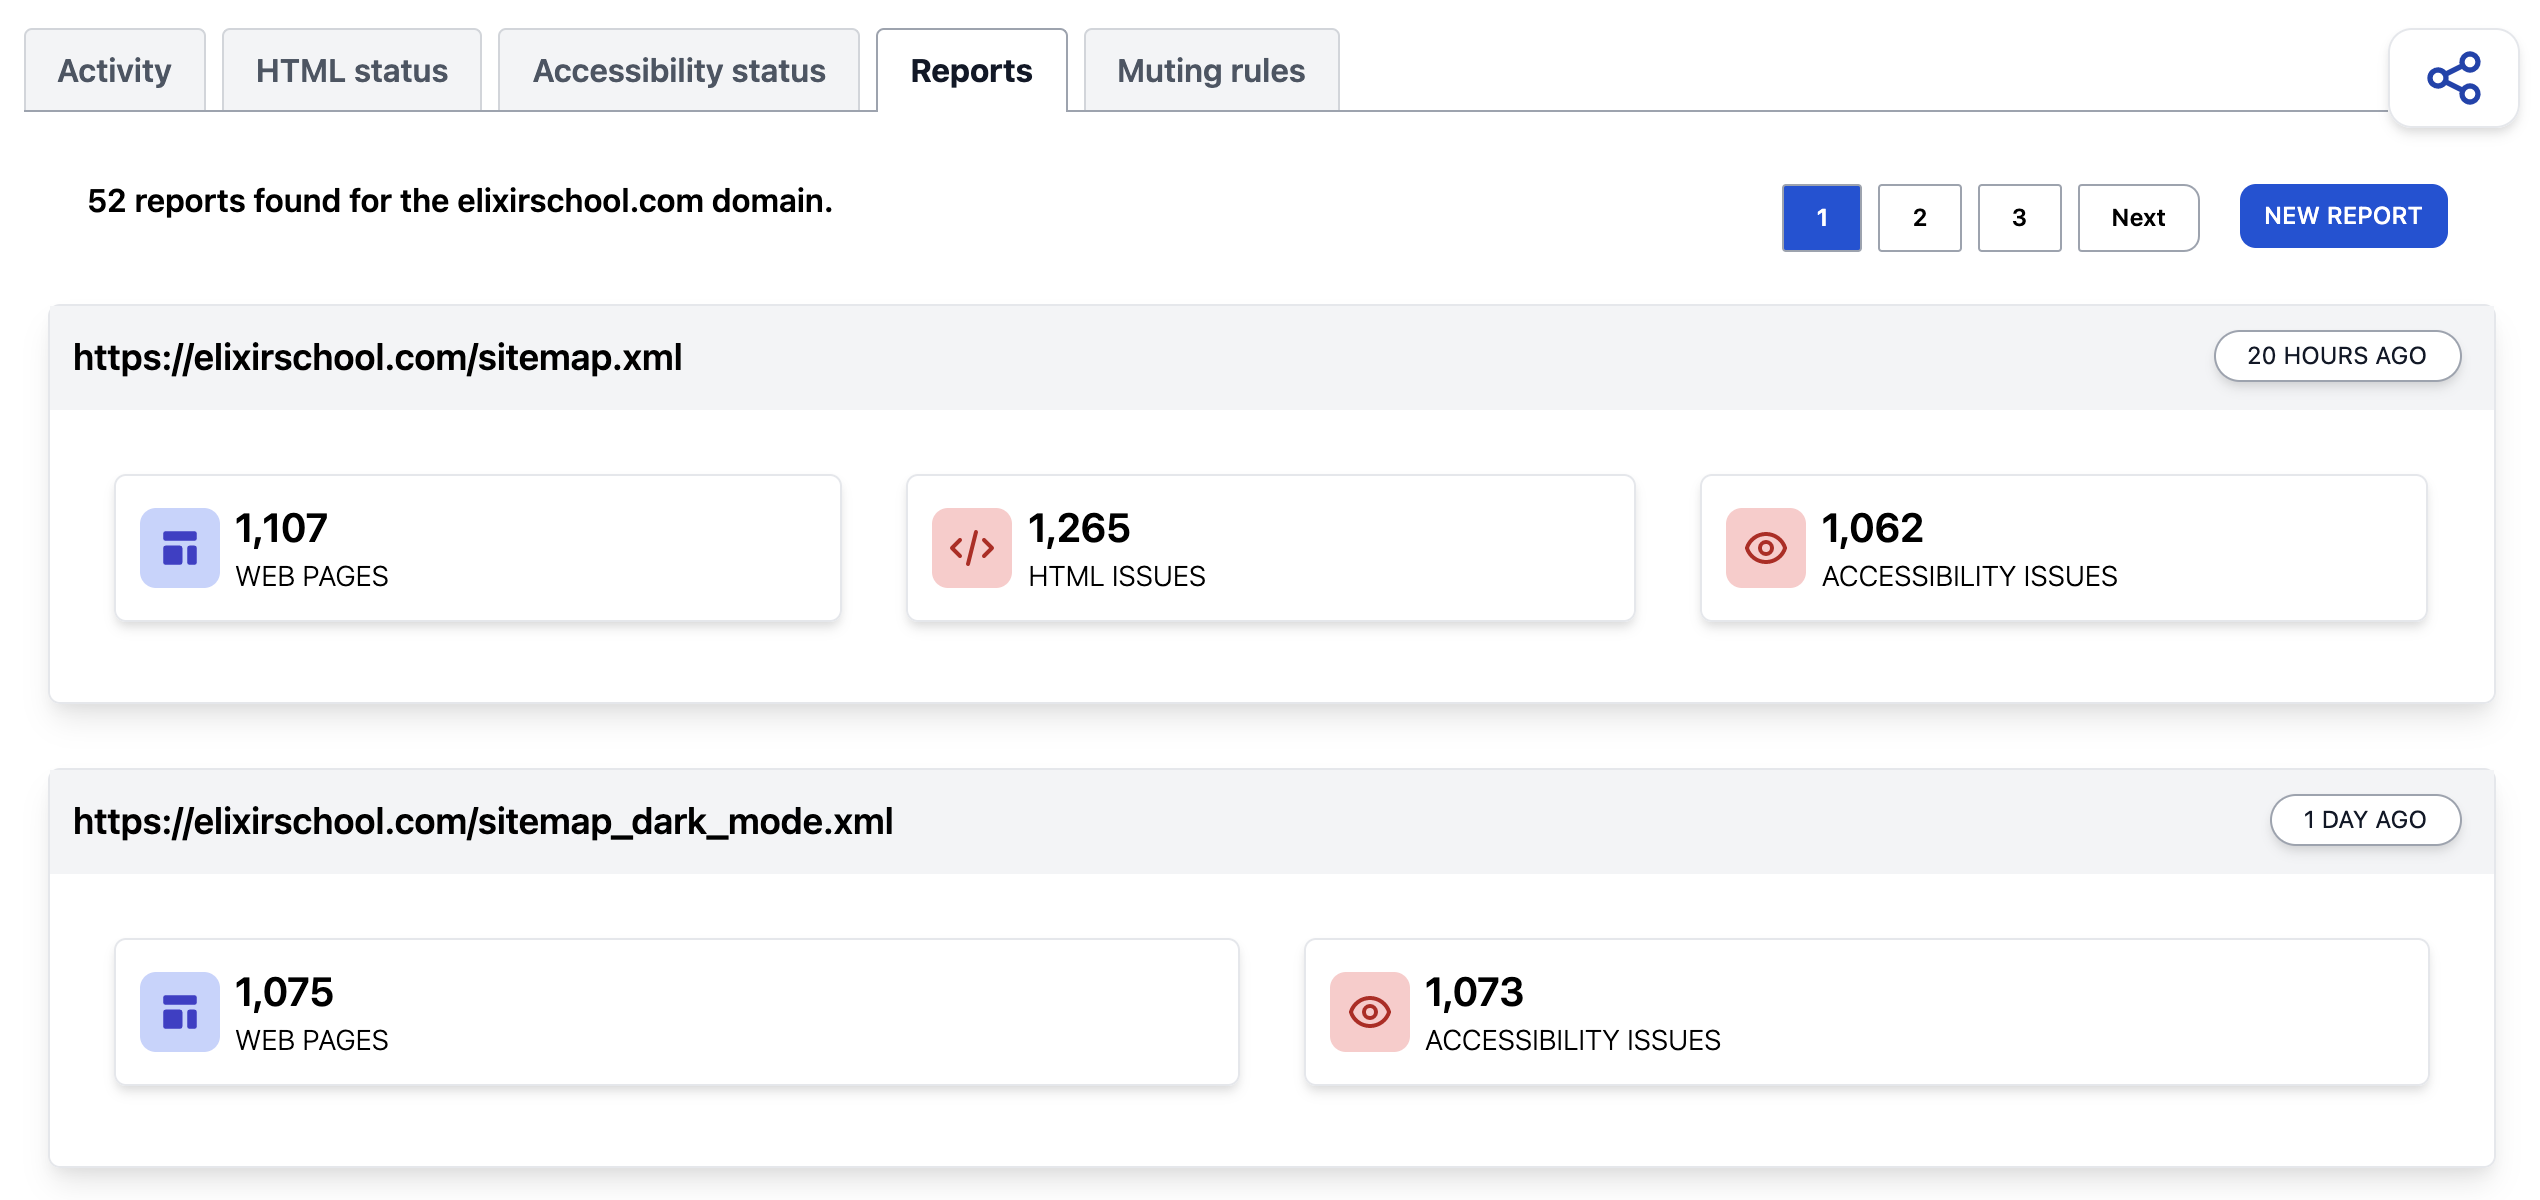
The Reports tab shows the current reports for a domain and lets you create a new report for it:
Muting rules applied on a domain
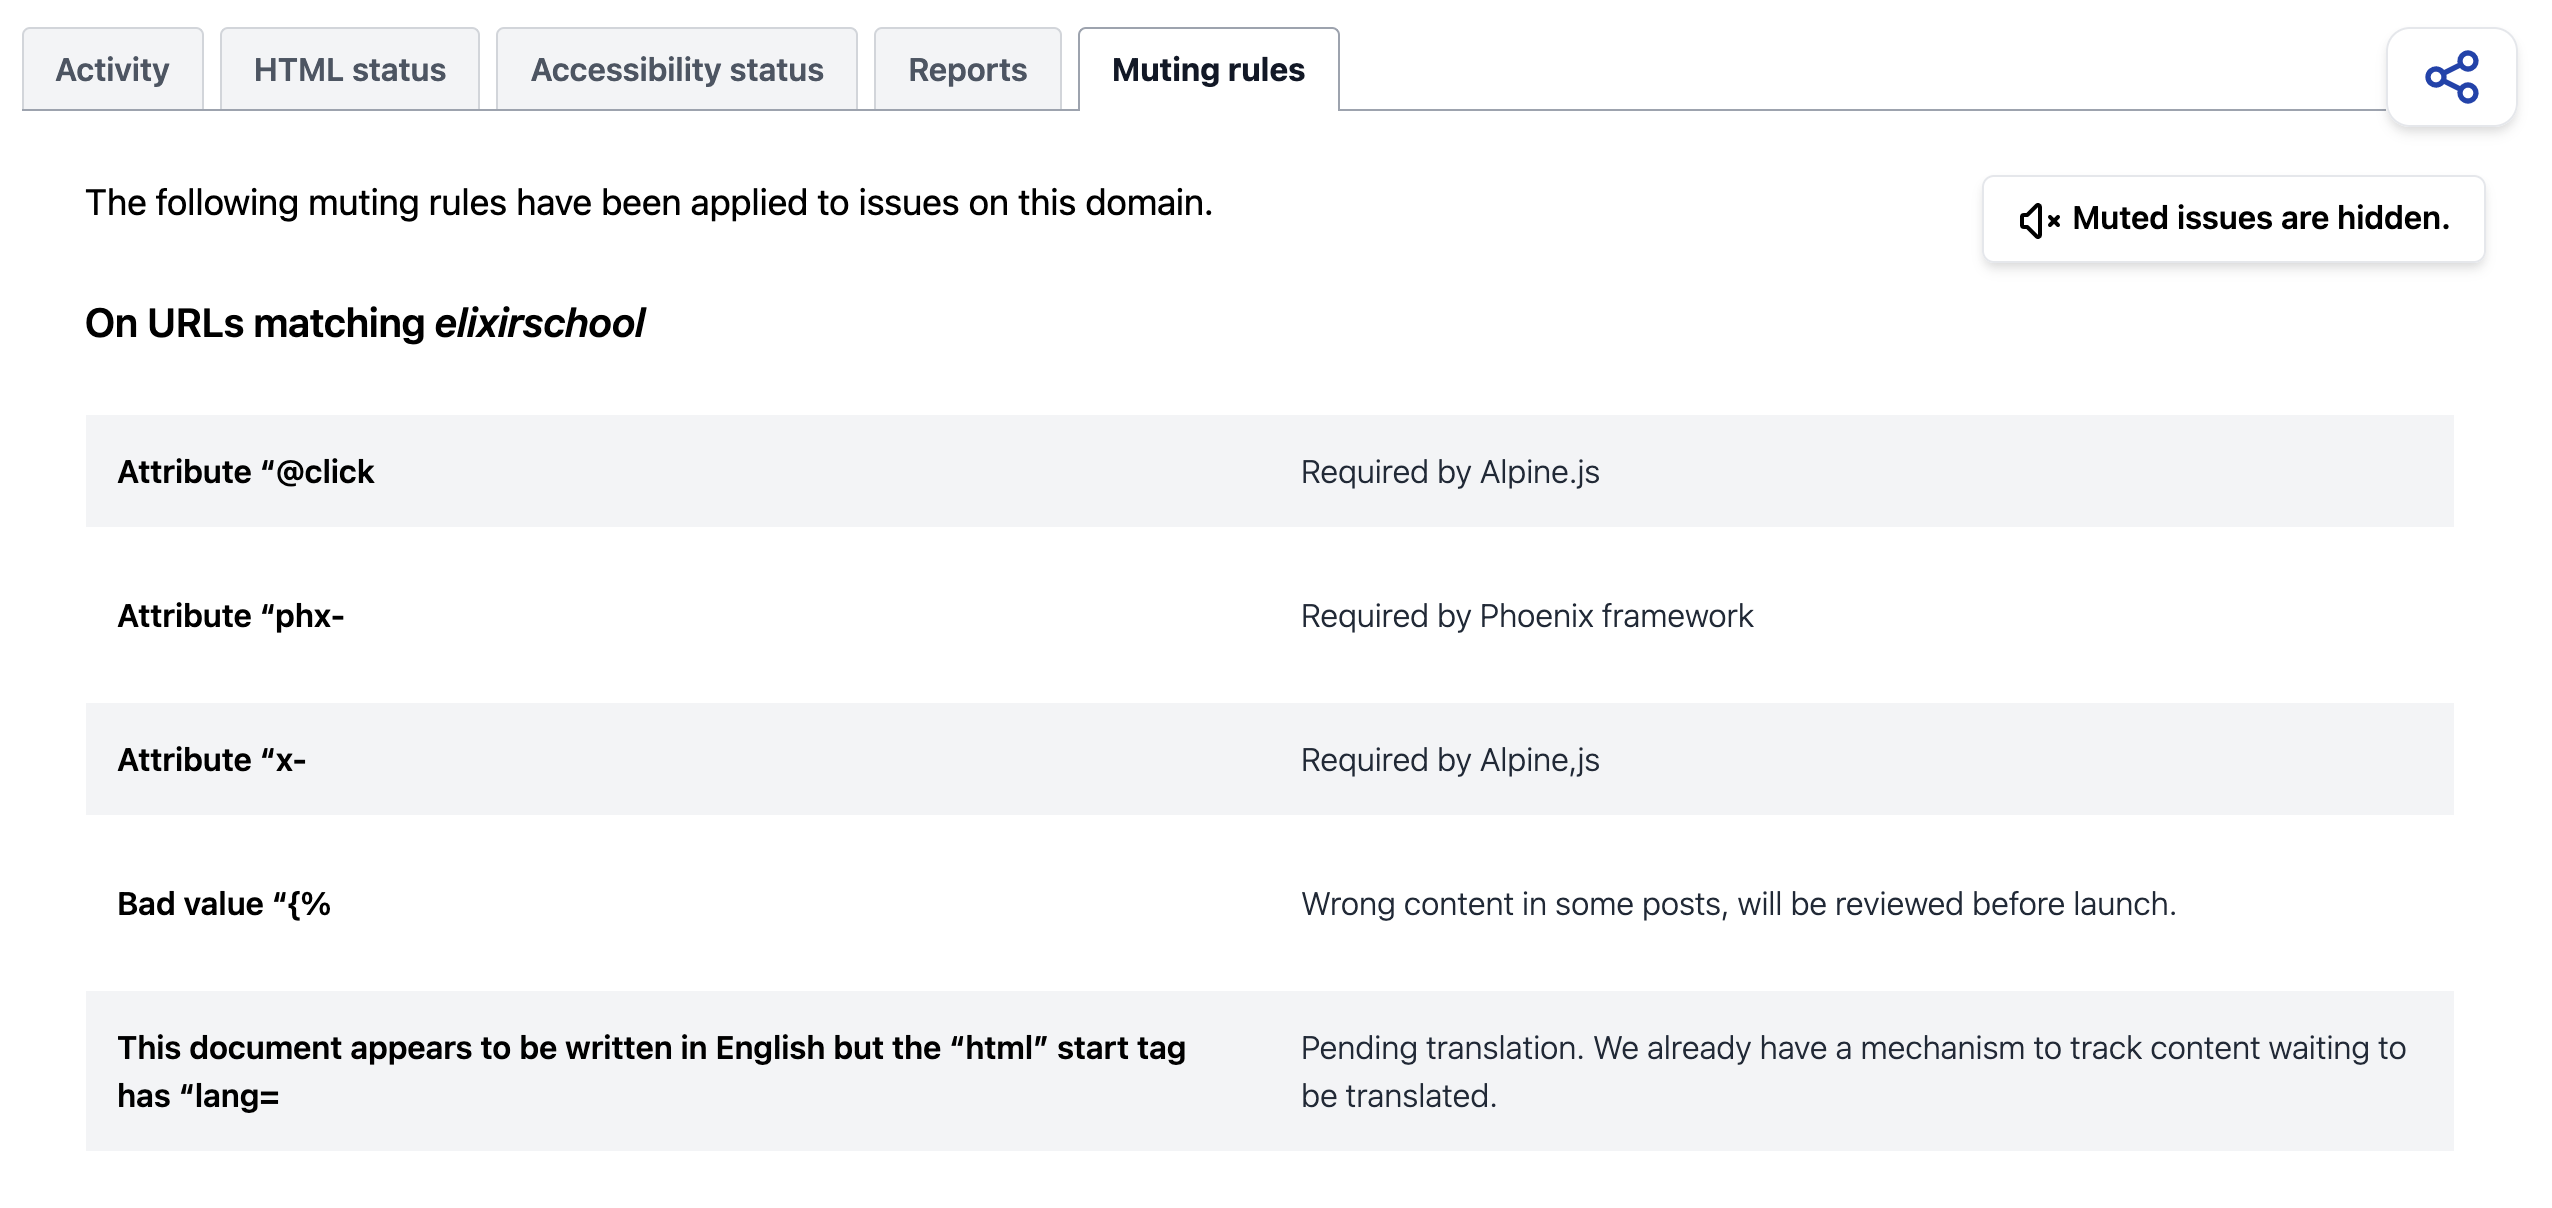
The Muting Rules tab shows the muting rules that are currently applied to the reports on that domain, and lets you toggle the visibility of muted issues.
Sharing domain stats
Sharing domain stats lets you easily give access to your colleagues to the latest stats and reports for a domain you’re working on.
